

Introducing Infrastructure-as-Diagram
TL/DR
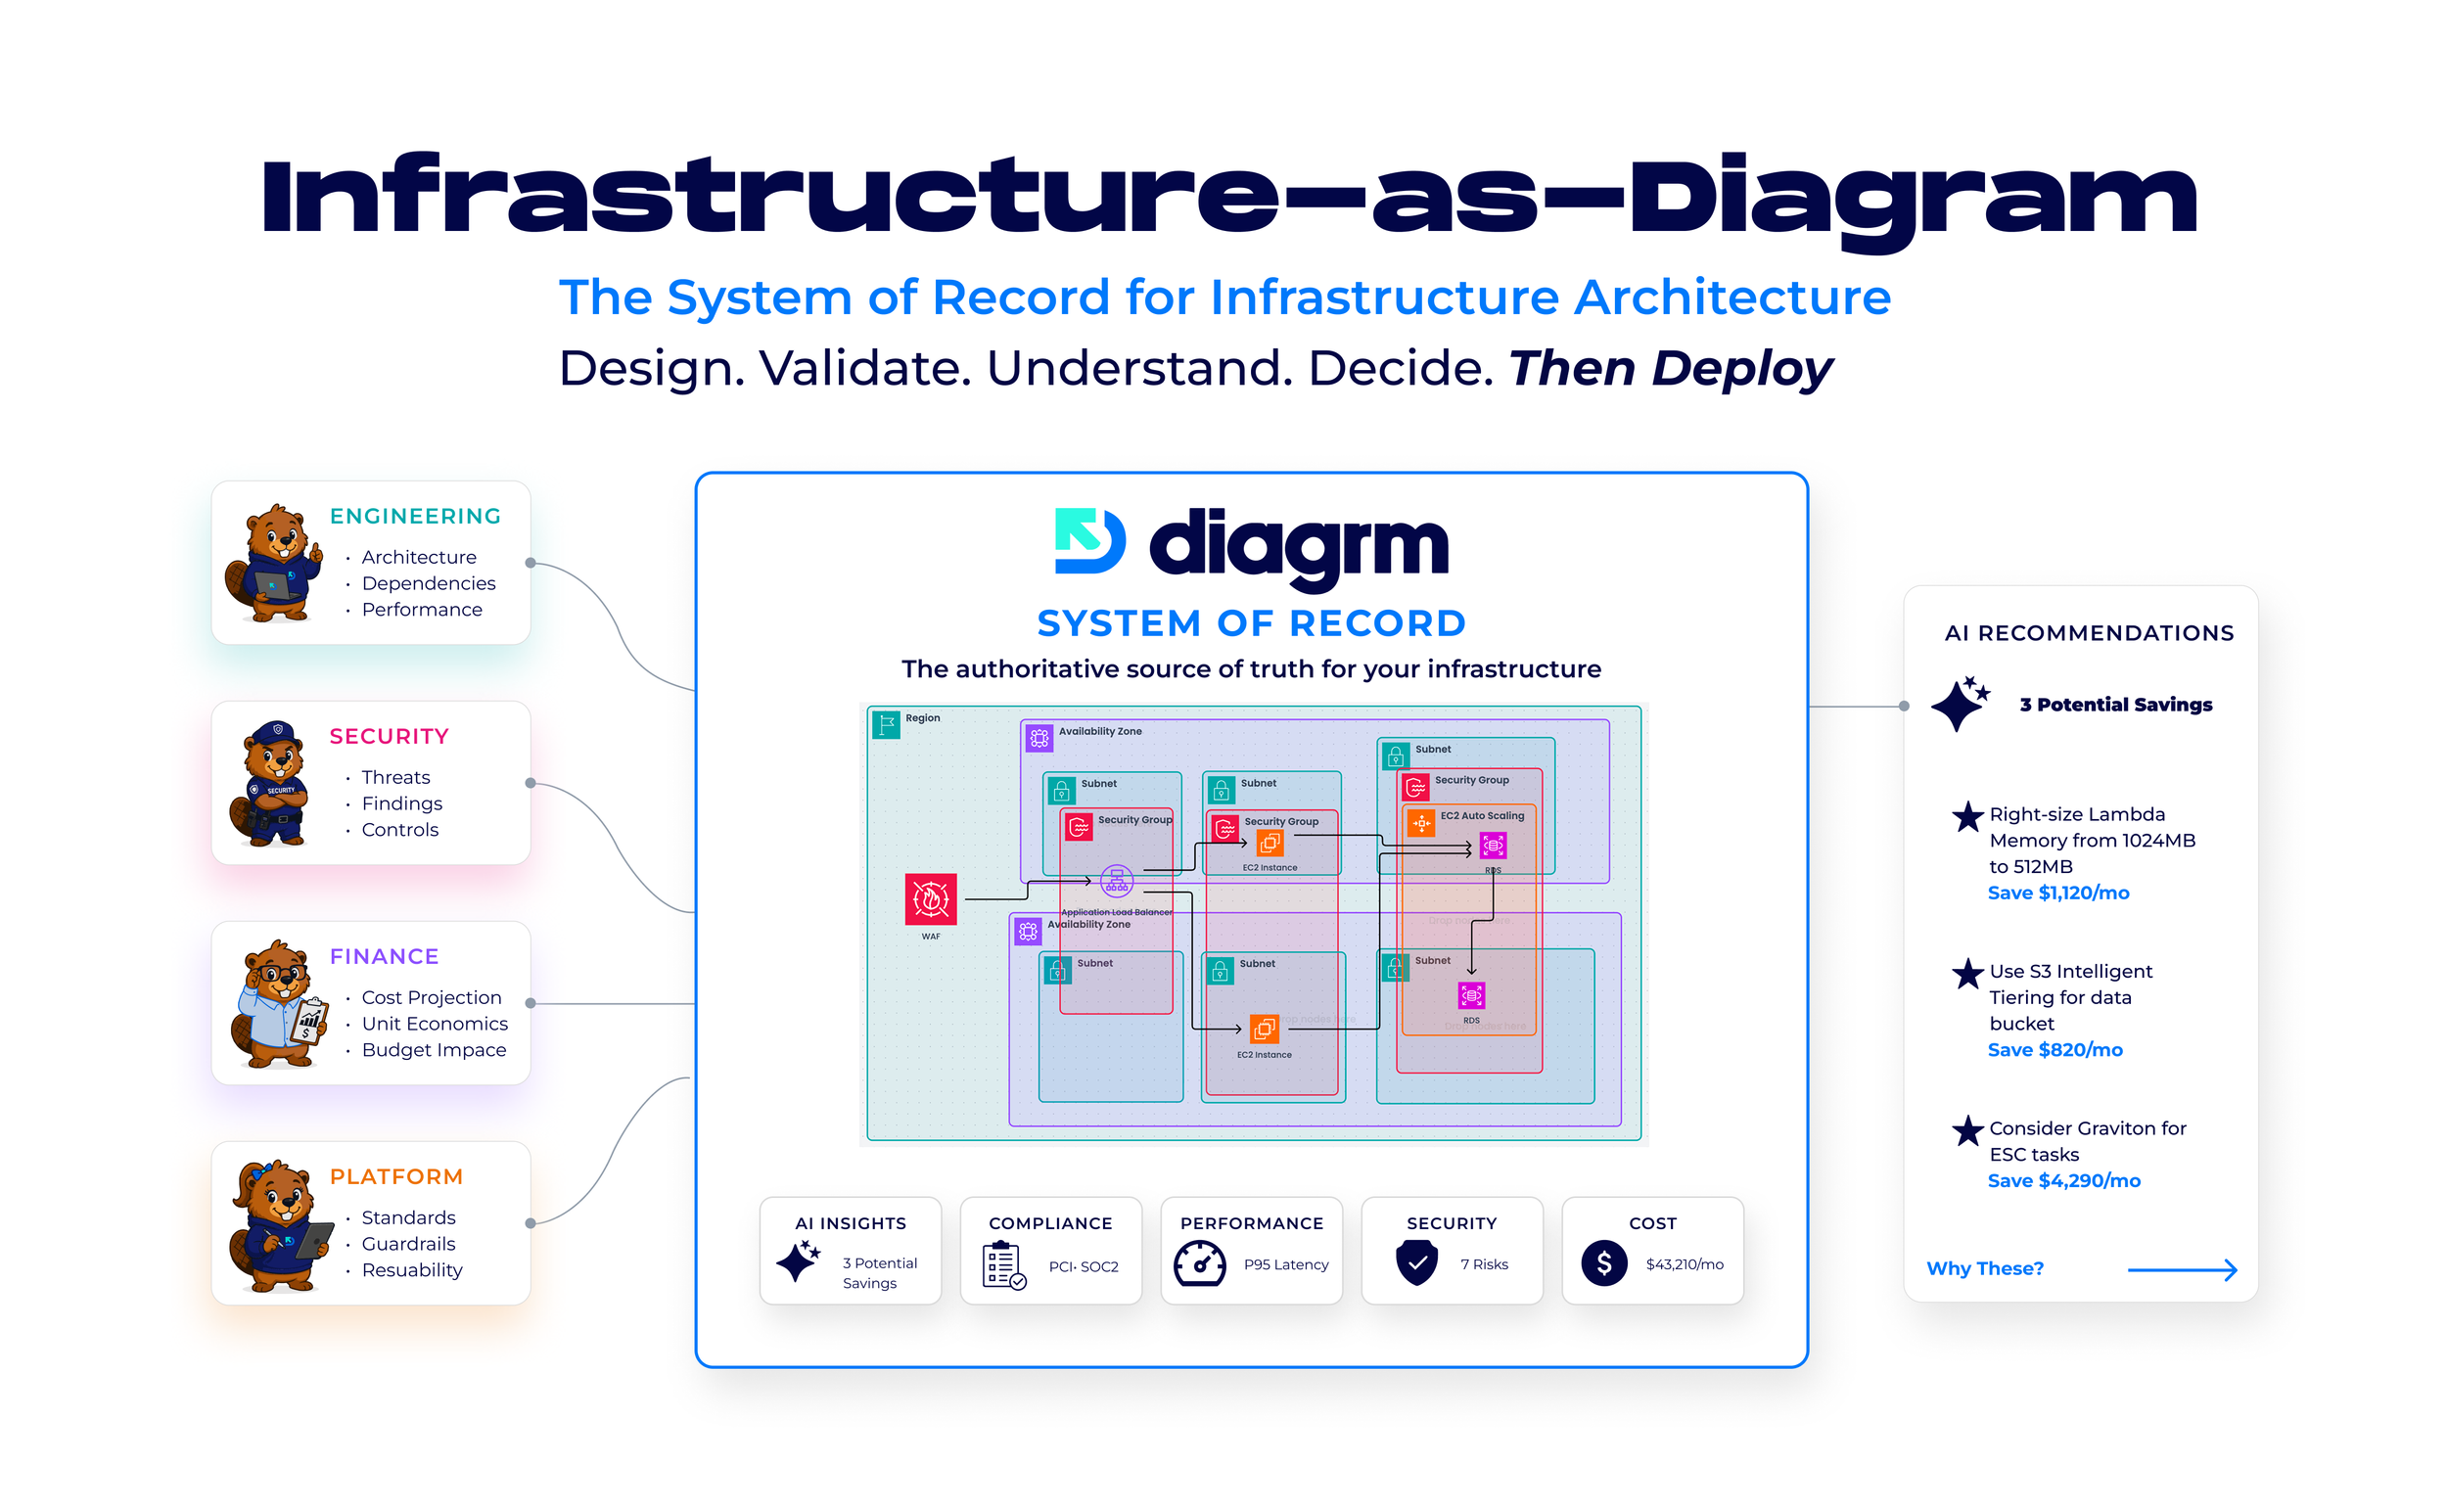
The New Category: Infrastructure-as-Diagram (IaD) shifts the diagram from passive documentation into an intelligent, operational blueprint. It is the missing design-time layer where teams can visually validate cost, risk, and compliance before code is deployed.
Design as a Commit: In an IaD model, every change on the canvas is an immutable, versioned declaration of intent. The diagram is the architecture—eliminating manual updates and preventing drift because there are no longer two separate records to sync.
The Strategic Shift: IaD unlocks four critical capabilities: it calculates projected cost before you spend, makes high-stakes decisions reversible via versioning, provides role-specific views (for security, finance, and engineering), and delivers deterministic, actionable analysis.
The Diagrm Vision: IaD isn’t a prettier drawing tool or an IaC replacement. Backed by the reality of 2026's skyrocketing AI infrastructure waste, Diagrm is building the primary operating system for infrastructure—allowing you to control your system's destiny while choices are still cheap to change.
What Is Infrastructure-as-Diagram?
Over the last four posts I've been building one argument, one piece at a time.
Architecture decisions drive most infrastructure outcomes, and they're made before anything is deployed. AI is multiplying the financial weight of every one of those decisions. The diagram that's supposed to help us manage architecture drifts away from reality almost immediately. And infrastructure — alone among the critical domains a company runs — has no system of record to hold the truth about itself.
Put those together and they point at the same missing thing. We are superb at deploying infrastructure and improving at observing it, but we have almost nothing for understanding it before we commit. This post is about the category I believe fills that gap. I call it Infrastructure-as-Diagram.
A different idea of what a diagram is
Infrastructure-as-Diagram starts from a deceptively simple shift. Instead of treating an architecture diagram as static documentation — a picture you draw and then abandon — it treats the diagram as an intelligent, operational blueprint: the authoritative model through which infrastructure is designed, validated, governed, deployed, and understood.
A traditional diagram describes a system. An Infrastructure-as-Diagram model lets you reason about one. That's the whole difference, and it's larger than it sounds. The same artifact that shows how components connect can also carry what they cost, where the risks are, what compliance they're subject to, and what the design is actually trying to achieve — and it can keep all of that current, because of one mechanism at the core of the idea.
Design as a commit
In Infrastructure-as-Diagram, the act of designing is the act of committing.
Every operation on the canvas — adding a service, connecting two components, changing a configuration — is captured as an immutable, versioned declaration of infrastructure intent, not as marks on a drawing someone has to remember to maintain. The diagram isn't a representation of the architecture that can fall out of sync with it. The diagram is the architecture, recorded at the moment each decision is made.
This is the answer to the drift problem from earlier in the series. A design-as-commit blueprint can't drift, because there aren't two artifacts to reconcile — there's one authoritative record, and it updates as a consequence of the work itself rather than as a chore layered on top of it. It's also what lets the diagram finally become the system of record infrastructure that has been missing: a place that captures not just what exists but why, and stays connected to reality by construction.
What that unlocks
None of this is about features for their own sake. Once the diagram is an authoritative, versioned model rather than a picture, four things change for the people who run infrastructure — each one a decision made better, earlier, and with less risk:
Cost before spend. Because the model knows what you're designing, it can project what the architecture will cost before a single resource is provisioned. The financial consequence of a design choice becomes visible at the moment you make it, not a quarter later on an invoice nobody can fully decode.
Reversible decisions. Because every design is versioned, you can compare two architectures side by side, weigh their consequences, and promote one deliberately — instead of discovering the implications only after deployment has made them permanent. And a design is not a deployment: the model captures intent, and you decide if and when to promote a version into production. Design-time truth and execution-time truth stay distinct.
One diagram, many lenses. The same model can be viewed through role-specific views — cost, security, performance, compliance, reliability — so an architect, a security reviewer, and a finance lead each see the system in the terms that matter to them while everyone works from a single source of truth. The blueprint becomes something the whole organization can read, not just the person who drew it.
Analysis you can act on. The model's findings are deterministic and explainable: each one states precisely why it was raised and what to change, rather than a probabilistic score nobody can confidently act on. In a domain where a false signal leads straight to a worse decision, that's not a nicety — it's what lets the blueprint carry authority across teams.
What it is not
Infrastructure-as-Diagram is not "better diagramming software." Prettier boxes and arrows don't address anything in this series. It's also not a replacement for your existing toolchain — your IaC, your observability, your FinOps and security tools all keep doing what they do well. Infrastructure-as-Diagram is the common model underneath them: the design-time layer they were all missing, and the system of record they can finally orient around. It's a new operating model for infrastructure, not a new drawing tool.
Why this is possible now, and not ten years ago
A fair question is why this category is emerging now. The honest answer is that several things had to become true at once. The cloud created the complexity that makes architecture hard to reason about. Infrastructure-as-Code established that infrastructure can be expressed as a model rather than assembled by hand. AI multiplied the stakes, turning small architectural choices into large financial ones — Flexera's 2026 report found wasted cloud spend rising for the first time in five years, attributed specifically to AI workloads, with that waste averaging roughly a third of cloud spend and reaching as high as 50% in the most over-provisioned environments. FinOps proved, with data and executive attention, that architecture drives cost. And modern AI models finally made real-time, design-time intelligence practical to build. None of those alone would be enough. Together, they make Infrastructure-as-Diagram both necessary and, for the first time, buildable.
Where this goes
The near-term value is concrete and immediate: see what your architecture will cost and where its risks are before you deploy it. But the longer arc is bigger. As architecture becomes the place infrastructure decisions are actually made, the blueprint becomes the primary point of access for infrastructure — the way Git became the primary point of access for code — and, over time, the foundation for an infrastructure operating system: the layer through which infrastructure is designed, understood, governed, and evolved, with an ecosystem of analysis and compliance built on top of it.
That's the company I'm building Diagrm to be. The thesis underneath all of it is the one this whole series has been arguing: the most important infrastructure decisions should be made when they're still decisions — visible, reversible, and understood — rather than discovered after they've hardened into production. Designing before deploying isn't a feature. It's a different way to run infrastructure, and it's overdue.
Infrastructure-as-Diagram is easier to see than to describe. If you want to design a cloud or AI architecture, watch its cost and risks update as you build, and deploy only once it's right, explore Diagrm
